![]()
The Straw Detector in the NA62 Experiment
The NA62 experiment is the successor of a previous kaon decay experiment (NA48) operated in the same experimental area at the CERN SPS (see Fig.1). In December 2008, the CERN Research Board has authorized the collaboration to build new detectors, which are tailored to measure the very rare decay:

The new experiment uses high-energy protons from the SPS (400 GeV/c) to produce a secondary hadron beam (6% kaons) of 75 GeV/c and high intensity (750 MHz).
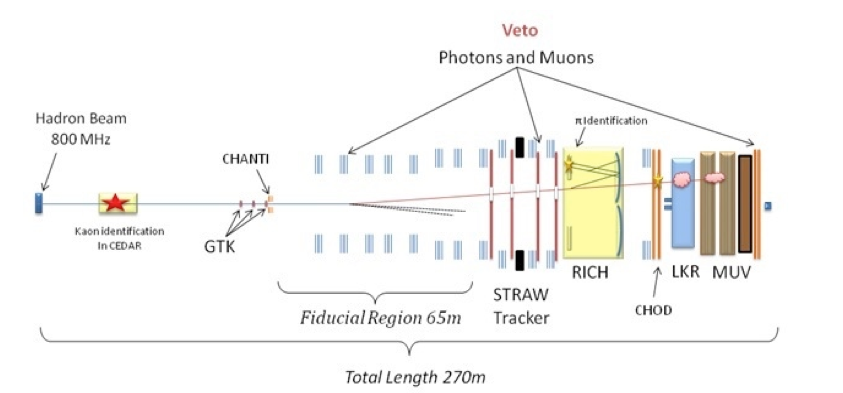
Fig. 1. Schematic layout of the NA62 experiment. The straws are inserted directly into the decay volume (fiducial region).
Simulations have shown that an overall material budget of around 2% radiation length, together with a resolution on the track position of about 130 μm and a resolution on momenta below 0.5%, correspond to a resolution on the missing mass m2miss= (PK+ - Pp+)2 below 10-3 GeV2/c4.
Detector Design and Constructrion
The NA62 straw tracker contains four straw chambers with a total of ~ 7200 straws. The active straw length is 2.1 m and the diameter is 9.85 mm. Each chamber is composed of two modules and each modules contains two views, (x,y) or (u,v). Chamber 4 just before installation is shown in Fig.2.
Each chamber measures four coordinates for every charged particle. The straws are separated from each other in order to guarantee the straw straightness as the straw diameter increases when the vacuum is created after the installation in NA62. The pressure inside the straws is 1 atm and the gas mixture is 70% Argon and 30% CO2.

Fig.2 The installation of chamber 4 in 2014.
The detector design is driven by the requirements to minimize the multiple scattering and at the same time guarantee detector efficiency and space resolution over the full region of acceptance. The straw is made from 36 μm thickpolyethylene terephthalate (PET), coated with 50 nm of copper and 20 nm of gold on the inside of the straw.
It is manufactured by ultrasonic welding with the seam along the straw axis. This allows for an axial pre-tension in straws of 1.5 kg, which guarantee straight straws during the operation of the detector and minimizes the need for supporting material (see Fig.3).

Fig.3 Detail of the “spacer” and spacer support. The spacer consists of thin ULTEM rings glued to a tensioned 0.1 mm metal wire. The spacer tension can be adjusted as well as its position. One of the four straw layers is completed.
Straw Readout
The front-end readout is based on the CARIOCA chip and a FPGA-based TDC mounted on the front-end cover close to the straw ends. A schematic view of the data flow is shown in Fig. 10. The straw readout board (SRB) collects the data from the cover and manages the trigger signals. Once a trigger has been received the SRBs send the data back to the PC-farm for treatment and storage. Each view has 30 covers and they are connected to two SRBs. The SRBs are mounted in the electronics racks, close to each chamber, together with high and low voltage power supplies.

Fig.4 A schematic of the data flow for the straw detector. The cover contains the FPGA-based TDC, which sends the to the SRB, for every straw hit, the time information (both leading and trailing edge).
Detector performance
The four straw chambers were installed and commissioned in October 2014. One gas cell (16 straws) was found to have a small leak and the leaking straw was identified and disconnected. A plug was glued at each end of the straw in order to stop the leak of gas into the decay volume. During the run in 2015, 7167 out of the 7168 straws were operational. The pressure around the straws was ~ 1x10⁻⁶ mbar and dominated by the CO2 diffusion. The total drift time in the straws is approximately 140 ns.
The online histograms are important tools for tuning the detector and monitoring the data quality. One example of online histograms is shown in Fig.12, where the straw activity is shown. The histograms are reset with a few bursts interval.
Both the leading and trailing edges are read out. The leading edge is used to measure the drift time and calculate the track position from the r-t relation. A single charged track with hits in all four chambers, has 27 straw hits on average and the time resolution is ~ 6 ns (see Fig. 14). The charged hodoscope (CHOD) gives the reference time and the resolution is ~ 300 ps.
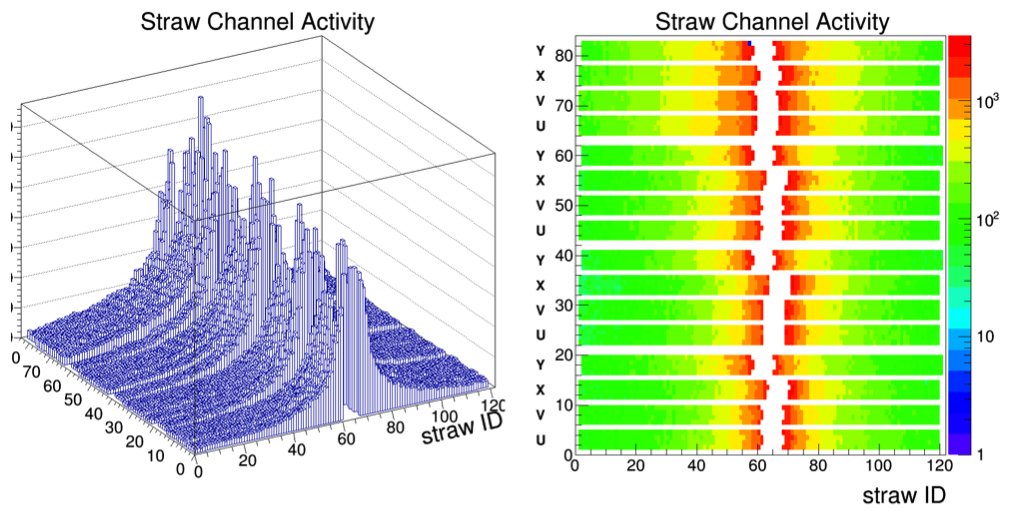
Fig.5 Online plot showing the hit activity straw by straw in all four chambers. One straw (blue point in the last layer in chamber 4) was disconnected and sealed in 2014 due to a small leak. The histogram shows triggered data as it is sent to the PC farm.

Fig. 6 Time resolution for single-track event. The ttrack is obtained from tracks having at least 27 straw hits and at least four hits in every chambers.