![]()
Aligning the ATLAS muon spectrometer
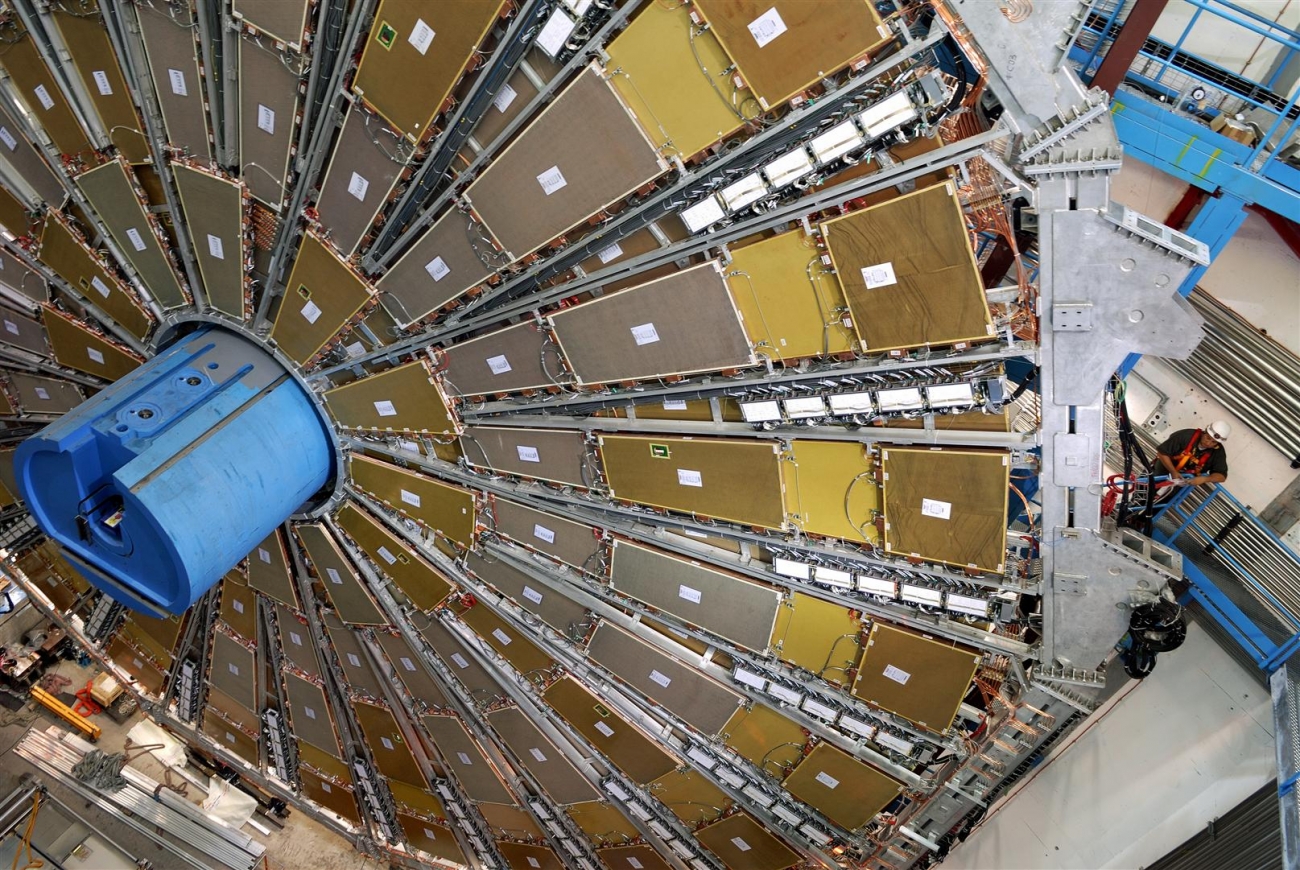
If you visit the ATLAS experimental cavern, the first thing you’ll see is the muon spectrometer: several thousand chambers that make up the outermost layer of the experiment (see image above). As muons fly out of the collision point, their tracks curve due to a surrounding toroidal magnetic field. By measuring this curvature (its sagitta), ATLAS physicists can derive the muon’s momentum.
Key to this measurement is a precise understanding of the muon spectrometer’s geometry. In a new result released this week, ATLAS physicists describe novel techniques used to accurately align the muon spectrometer.
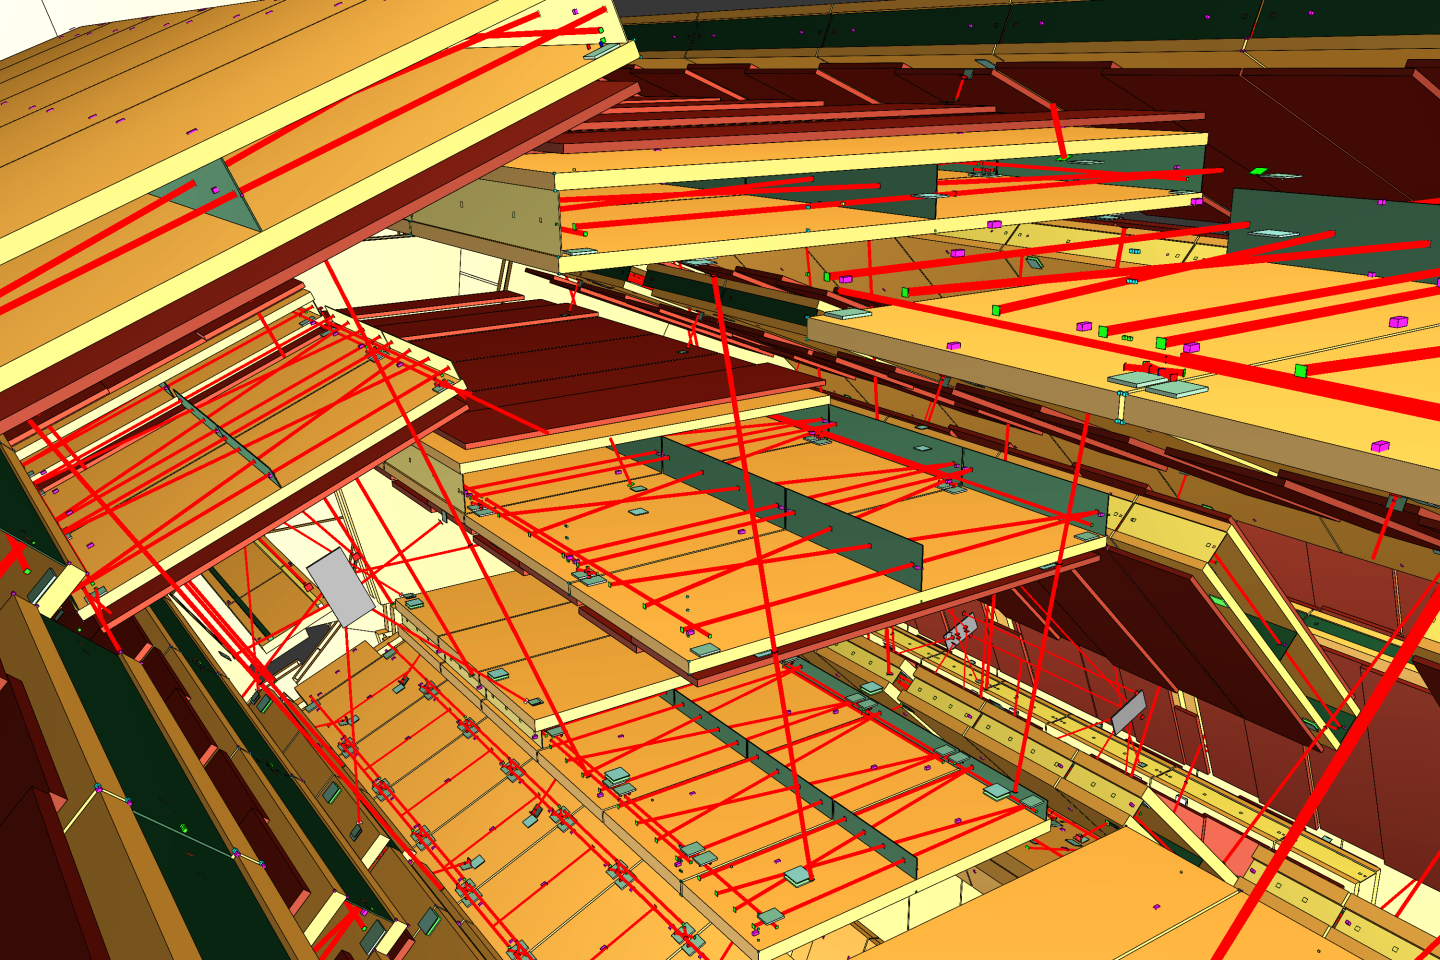
Fig. 1: A schematic view of the layout of the muon spectrometer chambers and of the optical system in the barrel region. The muon chambers are shown in gold. The red lines are the optical lines, comprising an illuminated target, a lens and an image sensor, each of which is attached with high precision to a muon chamber. The optical lines form a network of alignment detectors that monitor continuously the positions of the chambers relative to each other and their deformations. (Image: ATLAS Collaboration/CERN).
Following a moving detector
The diameter of a human hair is about 100 μm. Half that, 50 μm, is the accuracy to which ATLAS physicists strive to determine the positions of the muon detectors. In contrast, the diameter of the ATLAS muon spectrometer is more than 20 m – about half a million times the required alignment accuracy. At small scales, the geometry of the muon spectrometer is almost constantly changing, albeit slowly. Small temperature variations make the chambers and their support structures contract, expand and deform. Further, some of the chambers are mounted on the ATLAS toroid magnets, which themselves can occasionally move and deform.
The muon spectrometer is thus equipped with an optical alignment system that monitors in real time the positions of chambers relative to each other and to calibrated reference objects in the detector, as well as their deformations. The system consists of thousands of optical sensors (in essence, electronic cameras viewing distant illuminated targets – see Figure 1) and a similar number of temperature sensors (measuring distances between detector elements through their known thermal expansion properties).
The spectrometer geometry is computed from sensor measurements in a process called χ2 minimisation. Using a detailed mathematical model of the chambers and reference objects, physicists can simulate what each sensor’s measured value should be for a given set of chamber locations and deformations, and compare this to the real measurement obtained from the sensor. Physicists then adjust their mathematical model of the chambers to match, as well as possible, the real and simulated sensor measurements. These shifts and rotations are known as alignment corrections.
The optical alignment system can be used to detect and measure changes in the spectrometer geometry with time. This is known as the relative alignment: if a reference alignment is known at some point in time, the optical system can provide alignment corrections for any later moment in time. ATLAS physicists have used the relative-alignment mode to observe how the spectrometer geometry changes when the toroid magnets are switched on and off, for instance.
But how do you get a reference alignment?
It turns out the optical alignment system can also be used to determine the actual spectrometer geometry (not just changes of the geometry). This is the detector’s absolute alignment, which uses the optical system as a surveying system. This more ambitious use of the system requires the accurate calibration of all the alignment sensors, to a precision of about 20 μm relative to the active detector elements.
In ATLAS, these calibrations are known to be less accurate in some parts of the spectrometer than in others. Physicists have developed methods to successfully compensate; in addition to optical sensor measurements, data from muon tracks are used to determine the chamber alignment. These muon tracks are collected in special data-taking runs during which the toroid magnets are switched off, and hence the muon tracks are expected to be straight rather than curved.
However, things are complicated by an effect called multiple scattering. When particles traverse matter, such as detectors and mechanical support structures, they are deflected by many interactions with nuclei in the matter. This is a stochastic process and, while it is unpredictable for a single particle, scientists are able to predict the typical magnitude of the deflection for an ensemble of many particles. Further, the average deflection will be zero, since equal numbers of particles will be deflected to the right and to the left. Physicists can once again derive the sagitta, despite the fact that the actual trajectory of the particle will not be curved, as the magnetic field is off. In ATLAS jargon this is known as a false sagitta.
Improving the accuracy of the alignment is then straightforward: the χ2 minimisation process is enhanced by bringing the false sagittas of straight tracks as close to zero as possible.
New alignments for new detectors
The offset between a sensors-only alignment and a sensors-plus-tracks alignment can also be used to correct for the known shortcomings of the sensor calibrations in the absolute alignment mode. This offset is, in principle, an intrinsic property of the optical alignment system and is not expected to vary with time. However, whenever the geometry of the alignment system is changed, e.g. by adding new detectors or replacing old ones, a new offset has to be determined.
ATLAS physicists implemented a new sensors-plus-tracks alignment for the data-taking periods of 2017 and 2018. New detectors had been added to the muon spectrometer in a few locations, and other detectors had been disassembled and reassembled. This altered the spatial relationship between alignment sensors and active detector elements, and an update of the alignment offsets was necessary. The key result of this work is shown in Figure 2 where the average false sagitta of straight tracks is displayed for the alignment obtained by the methods described before.
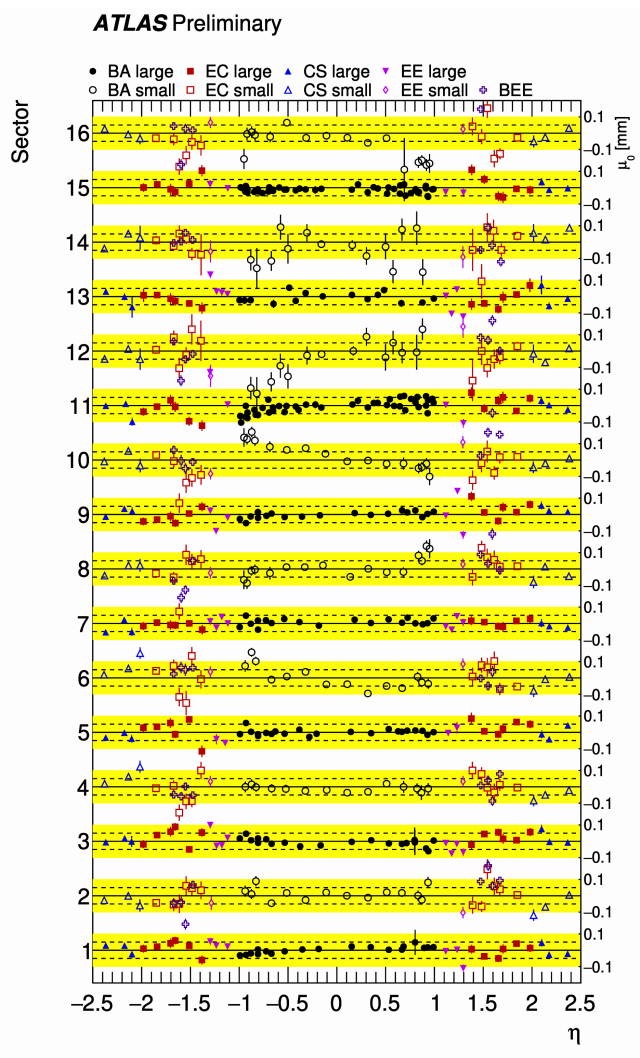
Fig. 2: The average false sagitta of straight tracks for the alignment obtained by the methods described in the text. Tracks are grouped in bins according to the angles at which they emerge from the interaction point: the sector number, counting from 1 to 16, represents the azimuthal angle, φ, and the pseudorapidity, η, is a measure of the polar angle, θ. A pseudorapidity of η=0 corresponds to θ=90° (orthogonal to the beam line), η=1 is approximately θ=40°, and η=2.5 is approximately θ=9.5° above the beam line. For each bin, the average false sagitta of the tracks is displayed by a symbol, and its statistical uncertainty is displayed as an error bar. (Image: ATLAS Collaboration/CERN).
For perfect alignment, at least 68.3% of the data points should have an average value that deviates from zero by less than the size of the error bar. For 95.5% of the bins, it should deviate by less than twice the size of the error bar; for 99.7%, by less than three times, etc.
This is nearly, but not exactly, what ATLAS observed. The deviations are just slightly greater than expected, indicating that the alignment is almost – but not quite – perfect. Judging from the observed deviations, the alignment is accurate to around 50 μm in a large part of the spectrometer volume, with some slightly poorer regions being closer to 100 μm.
In other words: the entire muon spectrometer has been kept aligned to an accuracy better than the diameter of a human hair. Such incredible precision is key to an experiment’s success, as evidenced by the excellent ATLAS results from Run 2 data.
Further Reading:
- Performance of the muon spectrometer alignment in 2017 and 2018 data (ATL-MUON-PUB-2021-002)